graphs & figures
White Females with Bipolar Disorder who Rarely/Never Receive Emotional Support
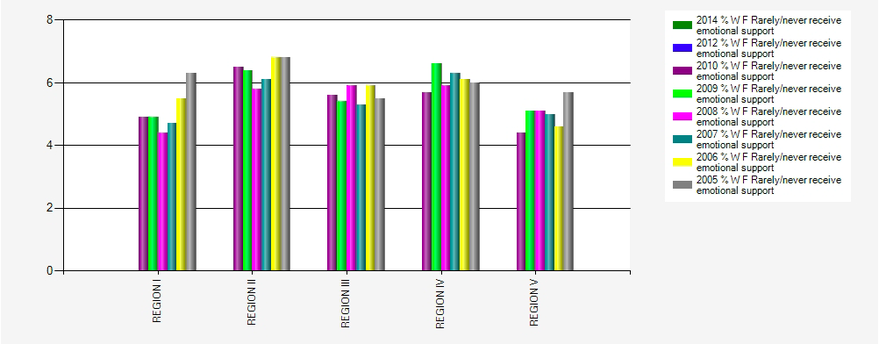
Office on Women's Health (2014). Quick Health Data Online. Retrieved from http://52.207.219.3/qhdo/owhexplore/GeoChart.aspx?&SESSION_ID=mxl1awidy3jovx45tqszyenr&QryType=persess
Madeline, O.- Summary:
This graph above shows how white women with bipolar disorder feel they rarely/never receive emotional support. The graph below is the same information but with men. This is important because having support is vital with a disorder like this. Looking at both graphs you can see that the women's data varies more, and the men's data is consistently higher. In both graphs, the highest data is in Region II. Region II includes Europe, Japan, the Middle East, Egypt, South Africa, Greenland.
Questions:
- Why is Region II so high, in both graphs?
- Why is the men's data consistently higher?
- Is it getting better or worse? Why do you think that?
White Males with Bipolar Disorder who Rarely/Never Receive Emotional Support
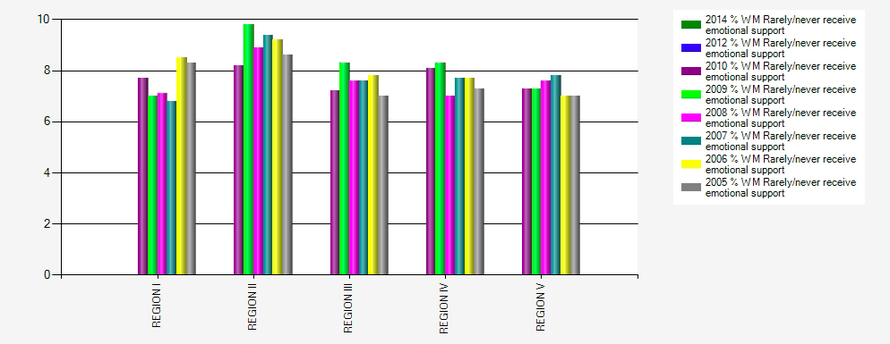
Office on Women's Health (2014). Quick Health Data Online. Retrieved from http://52.207.219.3/qhdo/owhexplore/GeoChart.aspx?&SESSION_ID=mxl1awidy3jovx45tqszyenr&QryType=persess
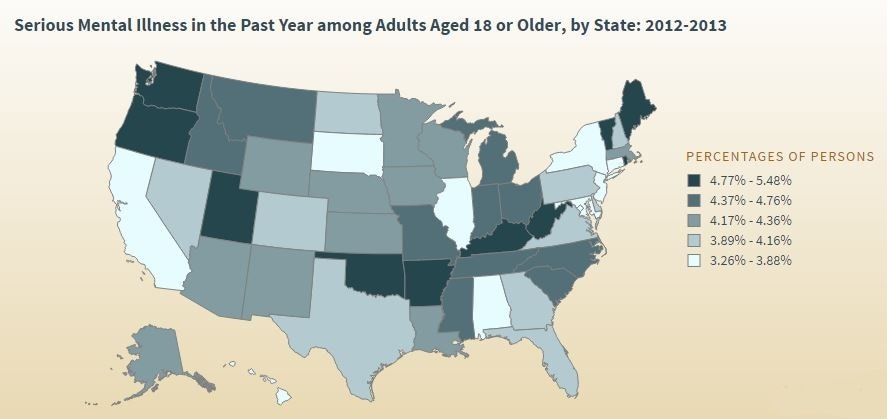
Julia, T.- The map above shows how prevalent serious mental illness is among people over 18 based on location. This data was collected from the Substance Abuse and Mental Health Services Administration (SAMHSA). In the figure, the darker blues show a higher rate while the lighter blues show a lower rate. Based on the numbers used to create the map, Vermont has the highest rate of serious mental illness while Maryland has the lowest.
Substance Abuse and Mental Health Services Administration. (n.d.). Retrieved April 24, 2017, from http://pdas.samhsa.gov/saes/state
Substance Abuse and Mental Health Services Administration. (n.d.). Retrieved April 24, 2017, from http://pdas.samhsa.gov/saes/state
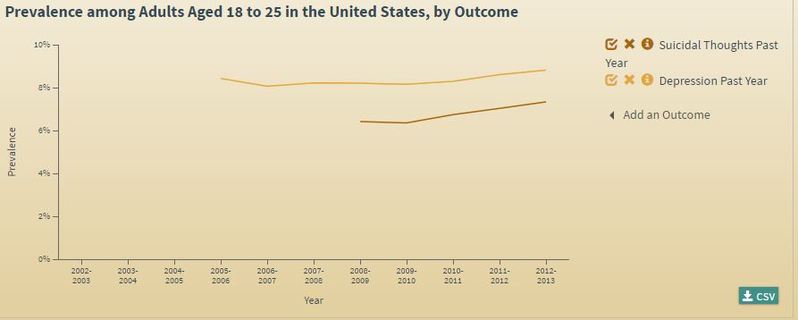
Albertine, M.- This graph is showing how many people with mental health have thoughts of suicide. Most of the data shows people between the ages of 18 to 25. The rates have gone up between the year of 2009-2013. Then it is compared to how many people have depression the past to suicidal thoughts.
